Knowledge Graph
16 min read
Knowledge Graph
A knowledge graph is a way of representing and organising information about the world in a form that people and machines can easily understand and use. It consists of nodes (entities) and edges (relations) that capture the facts, concepts, and connections that exist among them. In this article, we will explore what knowledge graphs are, how they are built, what they are used for, what are their advantages, and how they differ from other methods of data analysis.
What is a Knowledge Graph?
A knowledge graph is more than just a collection of data. It is a way of giving meaning and structure to the information about the world that machines can process and utilise. For example, a knowledge graph could have a node for “Albert Einstein” with edges to other nodes such as “physicist”, “Nobel Prize”, “Germany”, “relativity”, and so on. Each edge could also have a label or a property that specifies the type or the nature of the relation, such as “occupation”, “award”, “birthplace”, “theory”, etc.
A knowledge graph is not just a collection of data, but a way of making sense of it. It enables machines to answer complex questions, make inferences, and discover new insights that are not explicitly stated in the data. A knowledge graph can also be updated and extended with new information as it becomes available, making it a dynamic and evolving source of knowledge.
How do you build a knowledge graph?
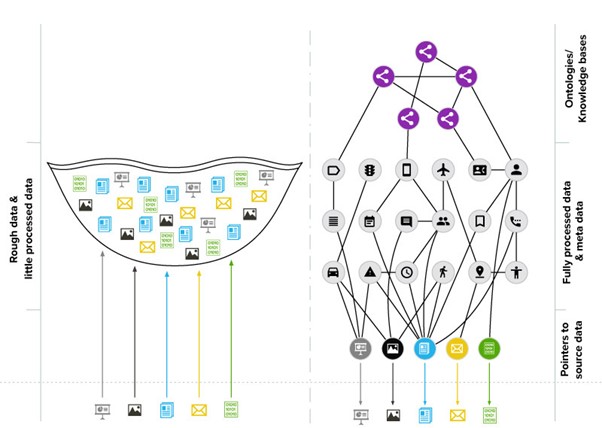
Building a knowledge graph is not a trivial task. It requires a combination of data sources, extraction methods, representation models, and reasoning engines. Here are some of the main steps involved in building a knowledge graph:
- Data acquisition: The first step is to collect and integrate data from various sources, such as databases, documents, web pages, social media, sensors, etc. The data can be structured or unstructured, and can have different formats, languages, and domains.
- Data extraction: The next step is to extract relevant information from the data, such as entities, relations, attributes, categories, etc. This can be done using techniques such as natural language processing, computer vision, machine learning, etc. The extracted information can be noisy and incomplete, and may need further cleaning and validation.
- Data representation: The extracted information needs to be represented in a way that machines can understand and manipulate. This can be done using models such as RDF, OWL, SKOS, etc. These models allow defining the schema, vocabulary, and semantics of the knowledge graph, as well as the rules and constraints that govern its structure and behaviour.
- Data reasoning: The final step is to use the knowledge graph to answer queries, make inferences, and discover new knowledge. This can be done using engines such as SPARQL, Prolog, Datalog, etc. These engines allow querying and manipulating the knowledge graph using logic, rules, and algorithms.
What is a knowledge graph used for? Which sectors use it?
Knowledge graphs have a wide range of applications and use cases across different sectors and domains. Some of the common ones are:
- Search engines: Knowledge graphs can enhance the quality and relevance of search results by understanding the user’s intent, context, and preferences. They can also provide rich snippets, cards, and answers that summarise the information the user is looking for. Examples of search engines that use knowledge graphs are Google, Bing, and Wolfram Alpha.
- Healthcare: Knowledge graphs can support the diagnosis, treatment, and prevention of diseases by integrating and analysing data from various sources, such as electronic health records, clinical trials, medical literature, and genomic data. They can also help the patients and caregivers by providing health education, guidance, and alerts. Examples of healthcare applications that use knowledge graphs are IBM Watson Health, Google Health, and Mayo Clinic.
- Criminal intelligence: Knowledge graphs can help the law enforcement and security agencies by detecting and preventing crimes, terrorism, and fraud. They can also help the investigators and analysts by linking and visualising data from multiple sources, such as criminal records, social media, surveillance cameras, and biometric data. Examples of criminal intelligence applications that use knowledge graphs are Palantir, Analyst’s Notebook, and i2 EIA.
- Financial sector: Knowledge graphs can help the banks and financial institutions by improving the customer service, risk management, and compliance. They can also help the traders and investors by providing market insights, trends, and forecasts. Examples of financial sector applications that use knowledge graphs are Bloomberg, Thomson Reuters, and BlackRock.
What are the advantages of knowledge graphs?
Knowledge graphs have many advantages over traditional methods of data analysis, such as relational databases, spreadsheets, or text documents. Some of the main advantages are:
- They can handle any kind of data, no matter how diverse, complex, or dynamic it is. You don’t need to worry about fitting your data into rigid schemas or tables.
- They can capture the essence of the data, not just the surface. You can understand the meaning, context, and relationships of the data, not just the values or keywords.
- They can enable natural and intuitive queries, not just technical or artificial ones. You can ask questions in natural language and get semantic answers, not just syntactic or keyword-based ones.
- They can support reasoning and inference, not just retrieval or computation. You can use logic, rules, and algorithms to derive new knowledge from the existing data, not just fetch or calculate it.
- They can facilitate knowledge discovery and innovation, not just information delivery or consumption. You can explore, create, and share new insights and ideas from the data, not just receive or use it.
Is Neo4j a knowledge graph? What is a knowledge graph database?
Neo4j is a popular and powerful graph database that can store and query data as nodes and edges. However, Neo4j is not a knowledge graph by itself. A knowledge graph is more than just a graph database. It also requires a schema, a vocabulary, and a semantics that define the meaning and the logic of the data. A knowledge graph database is a graph database that supports these additional features.
To understand the difference between a graph database and a knowledge graph database, you can think of them as a library and a bookshelf. A graph database is like a bookshelf that can store and organise books by their titles, authors, genres, etc. A knowledge graph database is like a library that can also provide a catalogue, a dictionary, and a logic that explains what the books are about, how they are related, and what you can learn from them. A knowledge graph database can help you find the right books, answer your questions, and discover new knowledge.
A knowledge graph database can be built on top of Neo4j, by using tools and frameworks that provide the necessary components for creating and managing a knowledge graph.
What is the importance of knowledge graphs for Big Data? Why are they important?
Big Data is a term that refers to the massive and complex datasets that are generated by various sources, such as social media, sensors, web pages, digital forensics etc. Big Data poses many challenges and opportunities for data analysis, such as volume, velocity, variety, veracity, and value. Knowledge graphs can help address these challenges and opportunities by providing a powerful and flexible way of managing and utilising Big Data. Knowledge graphs can help with the following aspects of Big Data:
- Volume: Knowledge graphs can handle large amounts of data by using distributed and scalable graph databases that can store and query data efficiently and effectively.
- Velocity: Knowledge graphs can handle fast and dynamic data by using streaming and real-time graph processing techniques that can update and query data continuously and instantly.
- Variety: Knowledge graphs can handle diverse and heterogeneous data by using semantic and schema-less graph models that can integrate and harmonize data from different sources and formats.
- Veracity: Knowledge graphs can handle noisy and uncertain data by using probabilistic and fuzzy graph methods that can deal with data quality and reliability issues.
- Value: Knowledge graphs can help extract value and insights from data by using graph analytics and machine learning techniques that can perform complex and advanced data analysis tasks.
How does the knowledge graph help intelligence agencies and police?
Knowledge graphs can help the intelligence agencies and police by providing a comprehensive and holistic view of the data related to crime, terrorism, and security. They can help with the following tasks:
- Data integration: Knowledge graphs can combine data from different sources and formats, such as criminal records, social media, surveillance cameras, biometric data, etc. This can help create a complete and consistent picture of the situation, such as who is involved, what is happening, where it is happening, when it happened, why it happened, and how it happened.
- Data analysis: Knowledge graphs can apply graph algorithms and machine learning techniques to the data, such as finding the shortest path, the most influential node, the most cohesive group, etc. This can help reveal the hidden patterns, trends, and anomalies in the data, such as who the key players are, what are the common behaviours, where are the hotspots, when are the peak times, why are the motives, and how are the methods.
- Data visualisation: Knowledge graphs can display the data using graph layouts, such as force-directed, hierarchical, radial, etc. This can help make the data more understandable and appealing, such as showing the structure, the hierarchy, the distance, the direction, the colour, the size, and the shape of the data.
- Data exploration: Knowledge graphs can enable data exploration using natural language and semantic queries, such as “Who are the associates of John Doe?”, “What are the common patterns of fraud in this region?”, etc. They can also support data exploration using graph navigation and recommendation, such as “Show me more details about this entity”, “Suggest me other entities that are related to this one”, etc. This can help answer the specific and general questions, as well as discover new and unexpected knowledge.
- Offender network analysis: One common application of graph analysis in criminal intelligence is link analysis, where police departments or intelligence agencies use it to identify potential suspects by analysing their connections to known criminals or gang members in the area.
- Link prediction: an advanced technique for predictive policing. It determines potential connections among entities. The methodology involves a training phase, using a graph to train a machine-learning model able to predict new or hidden links.
- Convicted offender monitoring: A co-offending network represents a graph linking individuals who have committed crimes together. Such networks are pivotal for law enforcement in understanding criminal groups engaging in concealed illegal activities, from terrorism to drug trafficking. Instead of focusing solely on individual suspects, the analysis includes group behaviour.
By using knowledge graphs, the intelligence agencies and police can improve their efficiency, accuracy, and effectiveness in detecting and preventing crimes, terrorism, and fraud. They can also enhance their collaboration and communication among different stakeholders and partners.
How do you detect fraud with a knowledge graph?
Fraud is a serious and costly problem that affects many domains, such as banking, insurance, e-commerce, etc. Fraud detection is the process of identifying and preventing fraudulent activities, such as identity theft, money laundering, credit card fraud, etc. Knowledge graphs can help with fraud detection by providing a comprehensive and holistic view of the data related to the transactions, the customers, the products, the locations, etc. They can help with the following tasks:
- Data combination: Knowledge graphs can create a unified and consistent data source that combines data from different sources and formats, such as transaction records, customer profiles, product catalogues, geospatial data, etc. This can help eliminate data silos and inconsistencies that may hinder fraud detection.
- Data investigation: Knowledge graphs can perform complex and advanced data analysis tasks that can detect and prevent fraud, such as finding anomalies, outliers, and patterns in the data, classifying and scoring the transactions and customers based on their risk levels, clustering and segmenting the data based on their similarities and differences, etc.
- Data presentation: Knowledge graphs can present the data in a clear and intuitive way that can help understand and communicate the fraud detection results, such as showing the connections and interactions among the entities and relations in the data, highlighting the suspicious and fraudulent cases and behaviours, filtering and zooming the data based on the criteria and preferences, etc.
- Data discovery: Knowledge graphs can enable data discovery that can help investigate and verify the fraud detection results, such as asking natural language and semantic questions about the data, navigating and recommending the data based on the interests and goals, discovering and learning new and unexpected knowledge from the data, etc. By using knowledge graphs, fraud detection can be more efficient, accurate, and effective. They can help identify and prevent fraud in real-time, reduce false positives and negatives, and increase customer satisfaction and loyalty.
What are the examples of knowledge graph use cases?
Knowledge graphs have many use cases across different domains and sectors. Here are some of the examples of knowledge graph use cases:
Financial
The financial sector deals with a lot of data related to the markets, the products, the customers, the regulations, etc. This data can be complex, dynamic, and sensitive, and requires careful and efficient management and analysis. Knowledge graphs can help the financial sector by providing a comprehensive and holistic view of this data, and enabling various tasks, such as:
- Market analysis: Knowledge graphs can help analyse the market trends, opportunities, and risks by integrating and analysing data from various sources, such as news, social media, reports, etc. They can also help provide market insights, forecasts, and recommendations.
- Product optimization: Knowledge graphs can help optimise the product portfolio, pricing, and promotions by understanding the customer needs, preferences, and behaviours. They can also help provide personalised and relevant product offers and suggestions.
- Customer service: Knowledge graphs can help improve customer service and satisfaction by providing natural language and semantic interfaces, such as chatbots, voice assistants, etc. They can also help provide quick and accurate answers, solutions, and feedback.
- Risk management: Knowledge graphs can help manage the risk and compliance by enforcing the rules and policies, such as KYC, AML, GDPR, etc. They can also help detect and prevent fraud, money laundering, and other illegal activities.
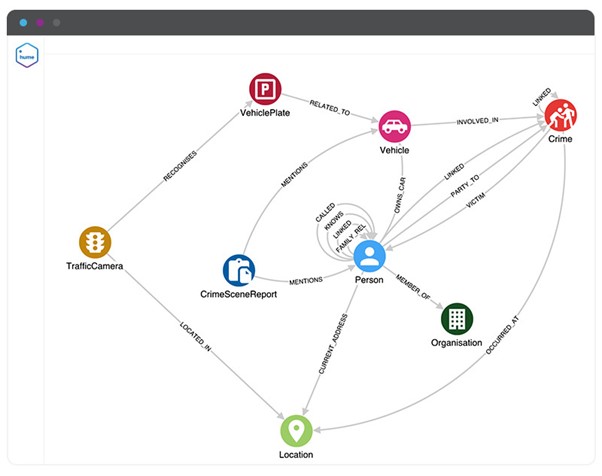
Criminal Investigation
The criminal investigation faces many challenges and opportunities in dealing with data related to the crimes, the suspects, the victims, the evidence, etc. This data can be diverse, heterogeneous, and incomplete, and requires thorough and effective integration and investigation. Knowledge graphs can help the criminal investigation by providing a comprehensive and holistic view of this data, and enabling various tasks, such as:
- Crime detection: Knowledge graphs can help detect and prevent crimes by integrating and analysing data from various sources, such as criminal records, social media, surveillance cameras, biometric data, etc. They can also help identify and alert the potential threats and risks.
- Crime investigation: Knowledge graphs can help investigate and solve crimes by applying graph algorithms and machine learning techniques, such as finding the shortest path, the most influential node, the most cohesive group, etc. They can also help reveal the hidden patterns, trends, and anomalies in the data.
- Crime visualisation: Knowledge graphs can help visualise and communicate the crime data by using graph layouts, such as force-directed, hierarchical, radial, etc. They can also use interactive and dynamic graph features, such as zooming, filtering, highlighting, etc.
- Crime exploration: Knowledge graphs can help explore and verify the crime data by using natural language and semantic queries, such as “Who are the associates of John Doe?”, “What are the common patterns of fraud in this region?”, etc. They can also support data exploration using graph navigation and recommendation, such as “Show me more details about this entity”, “Suggest me other entities that are related to this one”, etc.
Cyber security
Cyber security is constantly under threat and pressure from data related to the networks, the devices, the users, the attacks, etc. This data can be large, fast, and noisy, and requires real-time and accurate monitoring and detection. Knowledge graphs can help the cyber security by providing a comprehensive and holistic view of this data, and enabling various tasks, such as:
-
Network monitoring: Knowledge graphs can help monitor and manage the network performance and health by integrating and analysing data from various sources, such as logs, sensors, alerts, etc. They can also help identify and resolve the network issues and incidents.
-
Threat detection: Knowledge graphs can help detect and prevent cyber attacks by applying graph algorithms and machine learning techniques, such as anomaly detection, classification, clustering, etc. They can also help identify and alert the potential vulnerabilities and exploits.
-
Attack visualisation: Knowledge graphs can help visualise and communicate the attack data by using graph layouts, such as force-directed, hierarchical, radial, etc. They can also use interactive and dynamic graph features, such as zooming, filtering, highlighting, etc.
-
Attack exploration: Knowledge graphs can help explore and verify the attack data by using natural language and semantic queries, such as “What are the sources and targets of this attack?”, “Who are the attackers and what are their motives?”, etc. They can also support data exploration using graph navigation and recommendations, such as “Show me more details about this attack”, “Suggest me other attacks that are similar to this one”, etc.
What is the difference between knowledge graphs and link analysis?
Knowledge graphs and link analysis are both methods of data analysis that use graphs to represent and manipulate data. However, they are not the same thing. Knowledge graphs and link analysis have different goals, scopes, and features. Here are some of the main differences between them:
-
Goal: The goal of knowledge graphs is to provide a comprehensive and holistic view of the data that captures the meaning, context, and relationships of the data. The goal of link analysis is to provide a focused and specific view of the data that identifies the connections, interactions, and influences among the data.
-
Scope: The scope of knowledge graphs is to cover a wide range of domains and sectors, such as search engines, e-commerce, healthcare, education, etc. The scope of link analysis is to target a narrow and specialised domain or sector, such as criminal investigation, cyber security, social network analysis, etc.
-
Feature: The feature of knowledge graphs is to provide a rich and expressive data model that supports semantic and natural language queries, reasoning and inference, knowledge discovery and innovation, etc. The feature of link analysis is to provide a simple and efficient data model that supports graph algorithms, such as shortest path, centrality, community detection, etc. In summary, knowledge graphs and link analysis are both useful and powerful methods of data analysis, but they have different purposes, applications, and capabilities. Knowledge graphs are more suitable for general and complex data analysis tasks, while link analysis are more suitable for specific and simple data analysis tasks.