What is Big Data?
Let me start with a fascinating fact: 90% of the data we have today has been created in the past two years. Why is it so? It’s pretty simple – we’ve started realising that data is an important source of knowledge. And so we collect it. About EVERYTHING: people, animals, climate, nature, and anything else you can imagine.
Let’s say you’re an insurance company, and one of your services includes selling life insurance. Naturally, that will make you interested in people’s lifestyles. Do they enjoy adrenalin sports? Do they eat well? Where do they live? Is there a risk of natural disasters affecting them? What is their life expectancy? What about their parents? Do they have some chronic disease? These are just some things you need to know to create the right insurance plans. So you keep collecting information (privacy laws and regulations permitting). After some time, you have collected a massive amount of data. “Big data.” Now you have to store, clean, access, and analyse it. But before we get to that, it is essential to clarify what kind of information makes big data.
What classifies big data?
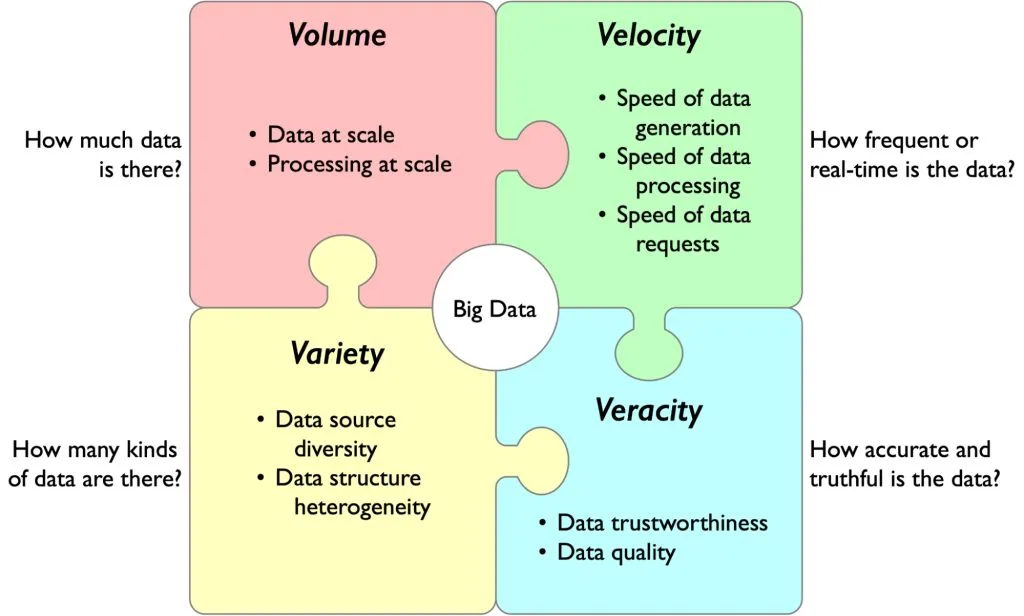
Big data is commonly defined by the 3 Vs = volume, velocity, and variety. The fourth V – veracity – has been added as a defining criterion later.
- Volume. Big data has to be BIG. A large amount of data translates to the need for scalability of both – storage and processing.
- Velocity. Data generation, collection, or processing of big data need to be fast – sometimes in (near) real-time. The author uses a great example of self-driving cars to illustrate this in the book. First, information from the sensors needs to be collected – someone is crossing the street. Then, it needs to be processed – the car should stop and let them cross. And finally, an action has to be taken as an outcome of the processing – car stopping. These three processes have to happen as quickly as possible.
- Variety. Big data comes from different sources, in different formats, structures, and sizes. With graphs, this heterogeneous data can then be connected in one place. Thus creating a single source of truth for your organisation.
- Veracity. Quality and trustworthiness of the data. Naturally, you need quality data to e.g., provide quality recommendations. This means you need to have quality data sources, but you also need to clean the data before processing.
90% of the data we have today has been created in the past two years.
Why is Big Data important?
Big Data is essential because it enables organizations to extract actionable insights from vast and complex datasets, significantly enhancing decision-making and strategic planning. By analyzing Big Data, companies can uncover hidden patterns, correlations, and trends that were previously inaccessible. This capability is crucial for staying competitive in today’s fast-paced, data-driven world. For instance, businesses can use Big Data analytics to understand customer behavior, preferences, and feedback, leading to more personalized marketing strategies and improved customer satisfaction. Additionally, Big Data helps in optimizing operations by identifying inefficiencies and predicting maintenance needs, thereby reducing costs and improving productivity. In the healthcare sector, Big Data analytics can lead to better patient outcomes by enabling predictive analytics for disease outbreaks, personalized treatment plans, and improved diagnostic accuracy. In finance, it helps in fraud detection and risk management by analyzing transaction patterns and identifying anomalies. Big Data also plays a pivotal role in criminal justice, where law enforcement agencies use data analytics to solve criminal cases more efficiently by identifying crime hotspots and predicting criminal behavior. Moreover, governments leverage Big Data to improve public services and ensure public safety. Overall, the importance of Big Data lies in its ability to transform raw data into valuable insights, driving innovation, efficiency, and growth across various sectors.
How is big data processed?
Processing Big Data involves several crucial stages that transform vast amounts of raw data into actionable insights. It begins with data collection from diverse sources such as social media, sensors, and transactional records, often requiring significant storage capacity managed by distributed systems like Hadoop Distributed File System (HDFS) or cloud-based solutions. The collected data, usually unstructured, undergoes preprocessing to clean and format it by removing duplicates, handling missing values, and converting it into a usable format, using tools like Apache Spark or Apache Flink for efficiency. The next stage is data analysis, where advanced analytics techniques are applied to extract insights. This stage employs machine learning algorithms, statistical methods, or complex queries facilitated by tools like Apache Spark, Hadoop MapReduce, and machine learning libraries such as TensorFlow and Scikit-Learn, which can process data in parallel across multiple nodes. Finally, the insights gained are visualised using tools like Tableau or Power BI, helping interpret the data and make informed decisions. This comprehensive process, from data collection to visualisation, ensures that Big Data can be effectively utilized to drive strategic decisions and innovations across various industries.
What is big data visualisation?
Big data visualisation encompasses various techniques aimed at transforming complex datasets into visual formats that are easily interpretable and actionable. Techniques include traditional charts and graphs such as bar charts, line charts, and pie charts, which are effective for representing numerical data and trends over time. Heatmaps and scatter plots are used to visualise correlations and relationships between variables. Geographic maps and geospatial visualisations display data across geographical locations, offering insights into regional trends and patterns. Advanced techniques like network diagrams and tree maps are employed to illustrate complex hierarchical relationships and network structures within data. Knowledge graphs and graph visualisations, on the other hand, help in representing interconnected data entities and their relationships, enhancing understanding of semantic connections and dependencies. Interactive visualisations allow users to explore data dynamically, filtering and drilling down into details for deeper insights. These techniques collectively enable organizations to leverage the power of big data to make informed decisions, identify opportunities, and solve complex problems efficiently.
Graph databases are good for dealing with big data
Graph databases consist of nodes (entities) connected by edges (relationships). Thus they can represent basically anything – one’s social network, roads, cities… Graphs are very intuitive because the schema they use mirrors the real world. The entities and relationships in these databases are equally important. Thus, graphs are useful when the connections among the data are essential. As we already learned, graph databases also allow you to use machine learning models optimally. Graphs are a perfect fit for dealing with big data because they help with:
Collection. Graphs can collect data from multiple data sources and create a single source of truth. Thus connecting your data silos (dispersed, independent data sources).
Storing. Data from different sources likely have other structures, sizes, and formats. Thanks to their flexible schema, graphs are ideal for storing data in various formats.
Cleaning. The various kinds of data have to be merged and cleaned into a logical structure. As graphs create a single source of truth, it is easy to merge duplicate data. Thanks to the graphs’ flexible schema, which can be updated at any time, it’s easy to make sure it models the data well.
Access. Graphs allow you to access specific parts of your data without having to look through the entire database. This means you can access the relevant data faster. The fast access patterns deal with data velocity, allowing for faster data processing.
Scaling graph databases
When dealing with big data, the need to scale your database is inevitable. Graph databases, like other NoSQL databases, scale horizontally. Meaning you can distribute the workload and increase performance by adding more machines. There are several options you can take when scaling your graph database:
Application-level sharding
Classical sharding is splitting the data from one database into several machines/storages. Generally, this is not as simple with graphs because of their high interconnectivity. You could split your data into clusters and store these on different shards. However, some clusters would probably be bigger than others, resulting in unbalanced shards. Whenever you have to execute a query or an analysis that spans across multiple sub-graphs, the performance would be heavily affected. Furthermore, if your data changes often (as big data does), this gets even more complicated.
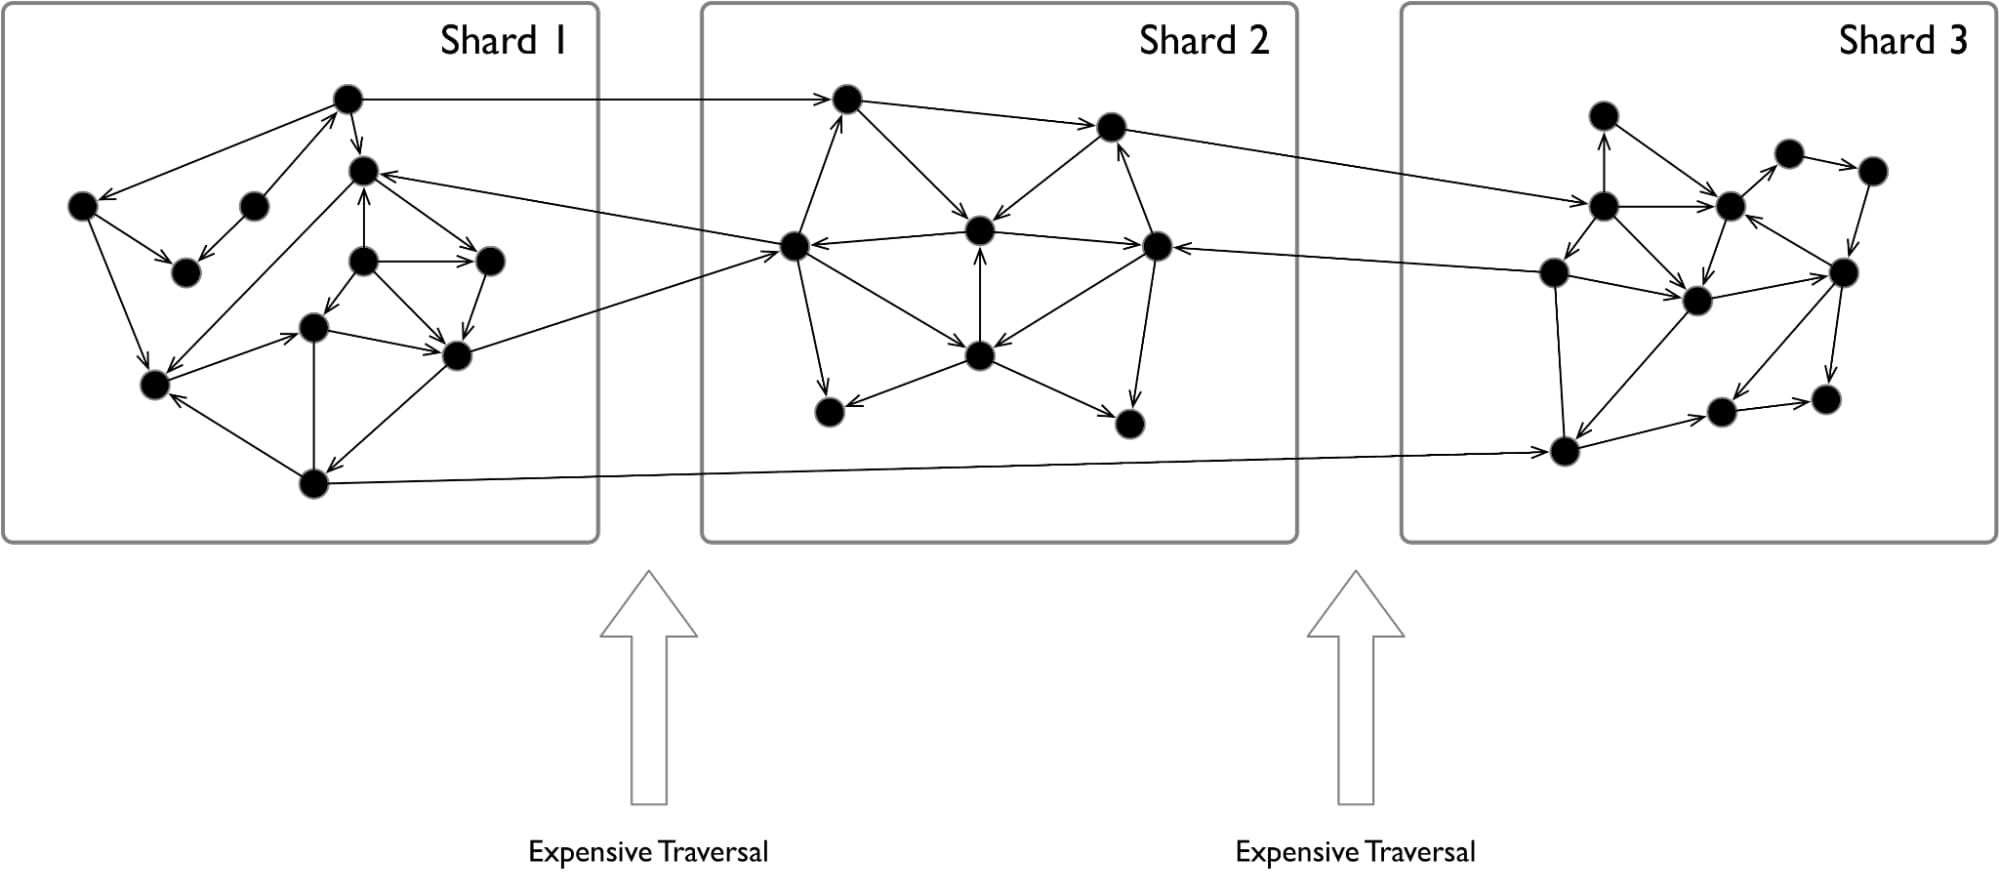
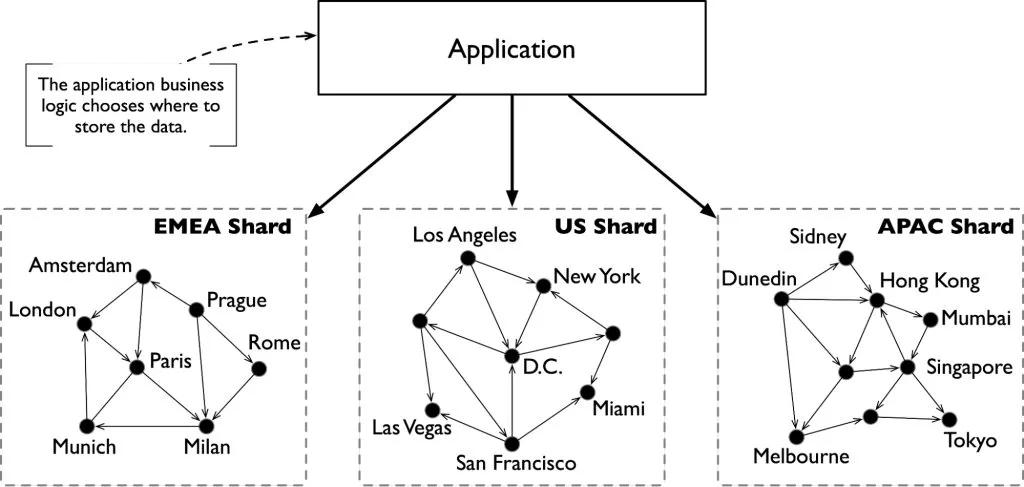
What you can do instead is use application-level sharding. This means the sharding occurs on the application side by using domain-specific knowledge. In other words, you split the data based on its kind, purpose, location it bounds to, etc.
Replication
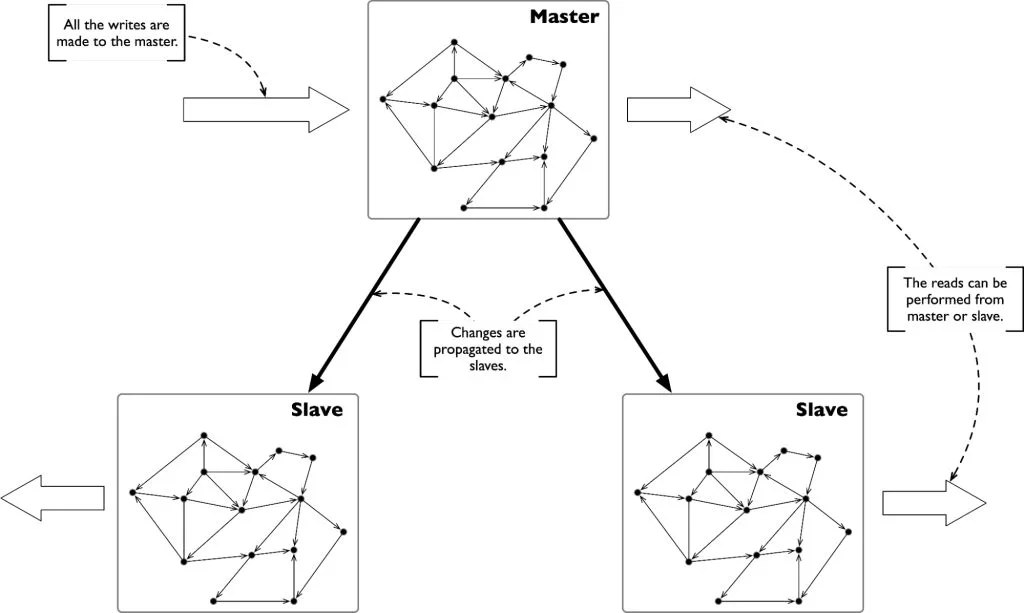
You can also achieve scaling of your database by adding more copies of the database. These replicas then act as followers with a “read-only” access. The main benefits here are better performance, and eliminating single points of failure. Even if some replicas are down, you can access identical copies of your database.
Increasing the RAM or using cache sharding
A very simple way of scaling your graph database would be to increase your RAM. But this is not a feasible solution for large datasets.
An alternative is to implement cache sharding. To do that, you need to first replicate your database to multiple instances in the same cluster. Then, leveraging the application layer, you can route your workload to specific instances. For example, one instance for US customer-related queries and another for the EU ones. Important here is that, unlike in classical sharding, your entire database is in each database instance. You can still access data that is not on your instance’s cache, and it just takes longer. Every instance will shape its cache to adapt it to its own workload (US related data vs. EU related data), aiming to keep it “warm” to its local needs. In this way, your graph will be distributed in multiple warm caches of specialised and high-performing instances.
Native vs. non-native graph databases
This takeaway is simple. There are two types of graph databases. Native and non-native. Native are better.
Native graph databases are built for graphs, from graphs, with graphs in mind. They are straightforward, intuitive, and performant. They use a storage structure that naturally fits in the mathematical graph model, for example, adjacency list or matrix.
Non-native graph databases can never achieve the same level of speed, performance, and optimization. This is because they layer a graph API on top of a different database. Thus a translation between graph and non-graph structure has to occur every time.
When dealing with big data, you want to avoid any unnecessary time spent on translations. The large volume, velocity, and variety of big data are all reasons for which you should opt for a native graph database.
LPG
LPG stands for Labelled Property Graph. LPG is a perspective you can take when looking at Knowledge Graphs. An alternative would be RDF. My colleague Giuseppe compared RDF and LPG perspectives in more detail when graphs are used as knowledge repositories.
In LPG, nodes can have classes/labels – for example, a person or a song. Both nodes and relationships can have attributes. These attributes describe and provide more details on the entities.
In the picture below, you can see our famous song graph. Here you can see artists I seem to like/whose songs I have shared in the 30 day song challenge (Sasa is something like my nickname). The artists have attributes like name, inception year, and so on. The artists are connected to my Person node by a LIKES_ARTIST relationship. Note that as a best practice, the name of a relationship should reflect its direction. This relationship could also have attributes with e.g., a score from 1-10 based on how many songs from them I have shared.
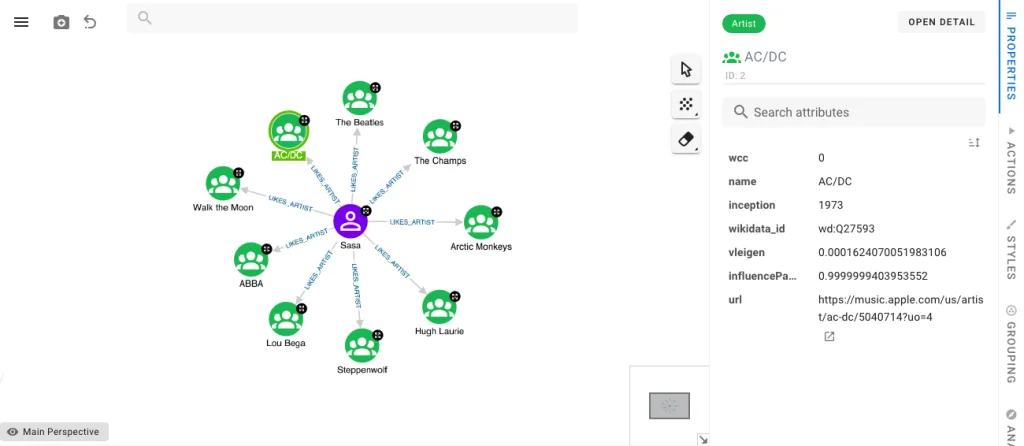
LPG allows projection, filtering, grouping, and counting – all useful in data analysis and exploration.
Conclusion
That might have seemed like a lot, but now you know:
- What classifies big data
- Why are graph databases a perfect fit for managing big data
- The basics of scaling graph databases
- The differences between native and non-native graph databases
- How does a labelled property graph look like – intuitive, and easy to read.
These takeaways will be helpful when we dive into the next chapter of Graph-Powered Machine Learning – Graphs in machine learning applications. I hope you enjoyed your reader’s digest, and I will be back with the next one in a couple of weeks.
