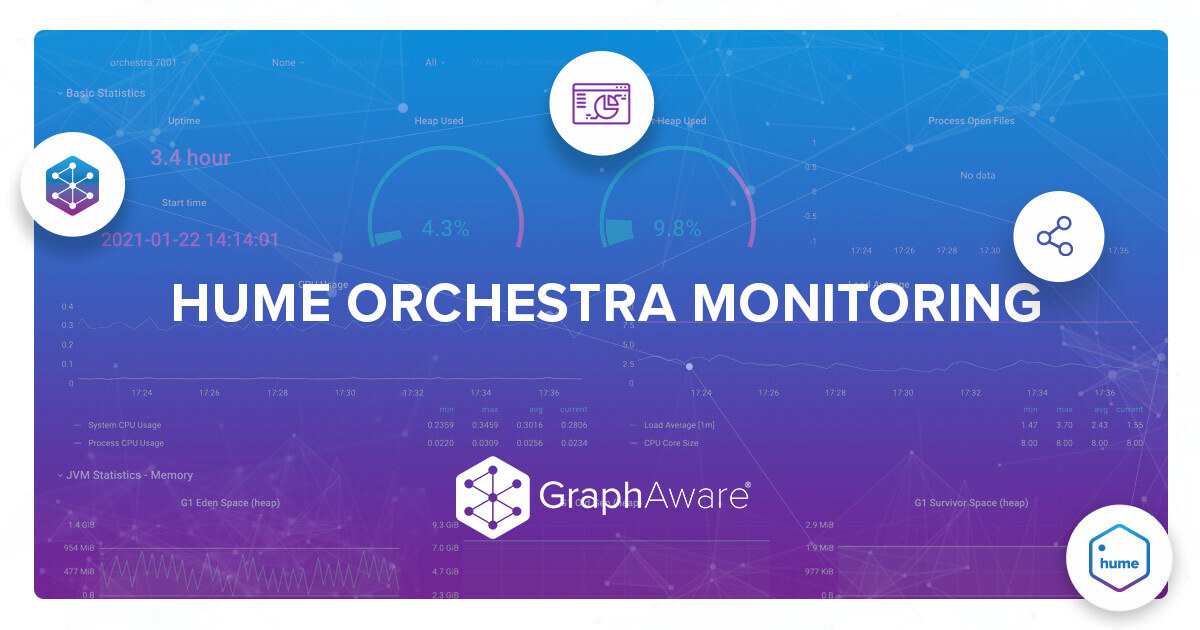
GraphAware Blog - Monitoring

Find out what's new in the world of mission-critical graph analytics.

Hume Orchestra Monitoring

Hume Orchestra Monitoring

12 Feb 2021 by Andrea Evangelista · 6 min read Hume Monitoring Orchestration

Enterprise Integration has existed since many, many years. Although it might seem like an old set of patterns, the reality is that more and more data silos, protocols and systems have been created in recent times which increase the need for the capabilities of an Enterprise Integration platform.

Monitoring Neo4j and Procedures with Prometheus and Grafana - Part 2

Monitoring Neo4j and Procedures with Prometheus and Grafana - Part 2

14 Jun 2019 by Miro Marchi · 20 min read Neo4j Monitoring Causal Cluster

This is the second of a two post series on monitoring the Neo4j graph database with popular enterprise solutions such as Prometheus and Grafana. Monitoring the status and performance of connected data processes is a crucial aspect of deploying graph based applications. In Part 1 we have seen how to expose the graph database internals and custom metrics to Prometheus, where they are stored as multi-dimensional time series.