Know (and use) what you know: Competing on Analytics with Knowledge Graphs #3
· 7 min read
In this 3-part series “Know what you know: Competing on Analytics with Knowledge Graphs” Dr. Alessandro Negro, Chief Scientist at GraphAware, walks you through analytics, knowledge graphs and its “competition”. In the first part we discussed the recipe for a successful analytics competition and shared some success stories. In the second part we saw the 4 first stages of the analytics revolution.
Analytics 5.0: Explainable AI and Knowledge Graphs
If you are sitting in a self-driving car, most probably you don’t care too much about how the machine learning algorithms process the data, coming from the multiple installed sensors, as long as you reach your destination safely and comfortably. On the other hand, what if a doctor prescribes you some treatments just by looking at a screen where a machine learning algorithm is suggesting some drugs according to your symptoms? What if an analytics platform is deciding who a police officer should arrest? In these scenarios, the trust we have for the algorithms, the data used and the resulting decisions matter since they are connected with health, reputation, and people’s lives. Despite their success in a broad range of tasks including advertising, movie and book recommendations, and mortgage qualification, when autonomous machines and black-box algorithms began making decisions previously entrusted to humans, it became necessary for these mechanisms to explain themselves because there is a general mistrust about their results. In 2016, Angwin et al. [3] analysed Correctional Offender Management Profiling for Alternative Sanctions (COMPAS), a widely used criminal risk assessment tool, and found that its predictions were unreliable and racially biased.
These considerations shed light on the reason why in the last few years, after 2015, explainable AI (XAI) became a very active research field and a clear trend in machine learning practice. It, specifically, addresses the limitations of the latest machine learning solutions that often provide highly accurate, but hardly scrutable and interpretable decisions [4]. XAI allows parts of the internal system of analytics engines to be more transparent, providing explanations of their decisions in some level of detail. These explanations are important to ensure algorithmic fairness, identify potential biases/problems in the training data, and ensure that the algorithms perform as expected.
From a broader AI perspective, opaqueness is only one of the very well-known limitations of modern analytics systems based on machine learning – along with the need for large training data (data hunger), the poor ability to generalise across tasks (brittleness), lack of causal or analogical reasoning (reactivity) [5]. For this reason, an increasing interest has been shown in the integration of Knowledge Representation techniques in machine learning with the goal of fostering the integration of symbolic, knowledge-driven AI (i.e. Knowledge Representation) and subsymbolic, data-driven AI (Machine Learning), mostly motivated by the complementary strengths and weaknesses that could lead to designing hybrid, more intelligent systems [6]. Continuing on this idea, Knowledge Graphs, which naturally provide domain background knowledge in a machine-and-human-readable format, could be integrated in Explainable Machine Learning approaches to help them provide more meaningful, insightful, and trustworthy explanations. Symbolic representations of data and information in the form of ontologies, knowledge bases and graph databases allow to formalise and capture knowledge and data about specific domains as well as general, encyclopaedic, knowledge [7]. Such formal knowledge represented as graphs, is machine-readable, mostly publicly accessible and, more importantly, linked across domains – allowing machines to discover knowledge in a structured but also unexpected way.
It is not only about explainability. Another concern is that it becomes necessary to bring the human back in the loop to improve the quality of the decisions and validate them. The intelligent advisor systems, where the analytics just suggest instead of acting on behalf of humans, are applied everywhere in healthcare, fraud detection, law enforcement, homeland security and so on. Whenever we talk about mission-critical applications, humans are a variable that cannot be removed. A person should see the “suggestions” but should be able to understand how the machine reached such a conclusion and evaluate if it is the correct one or not and make the final, informed, decisions.
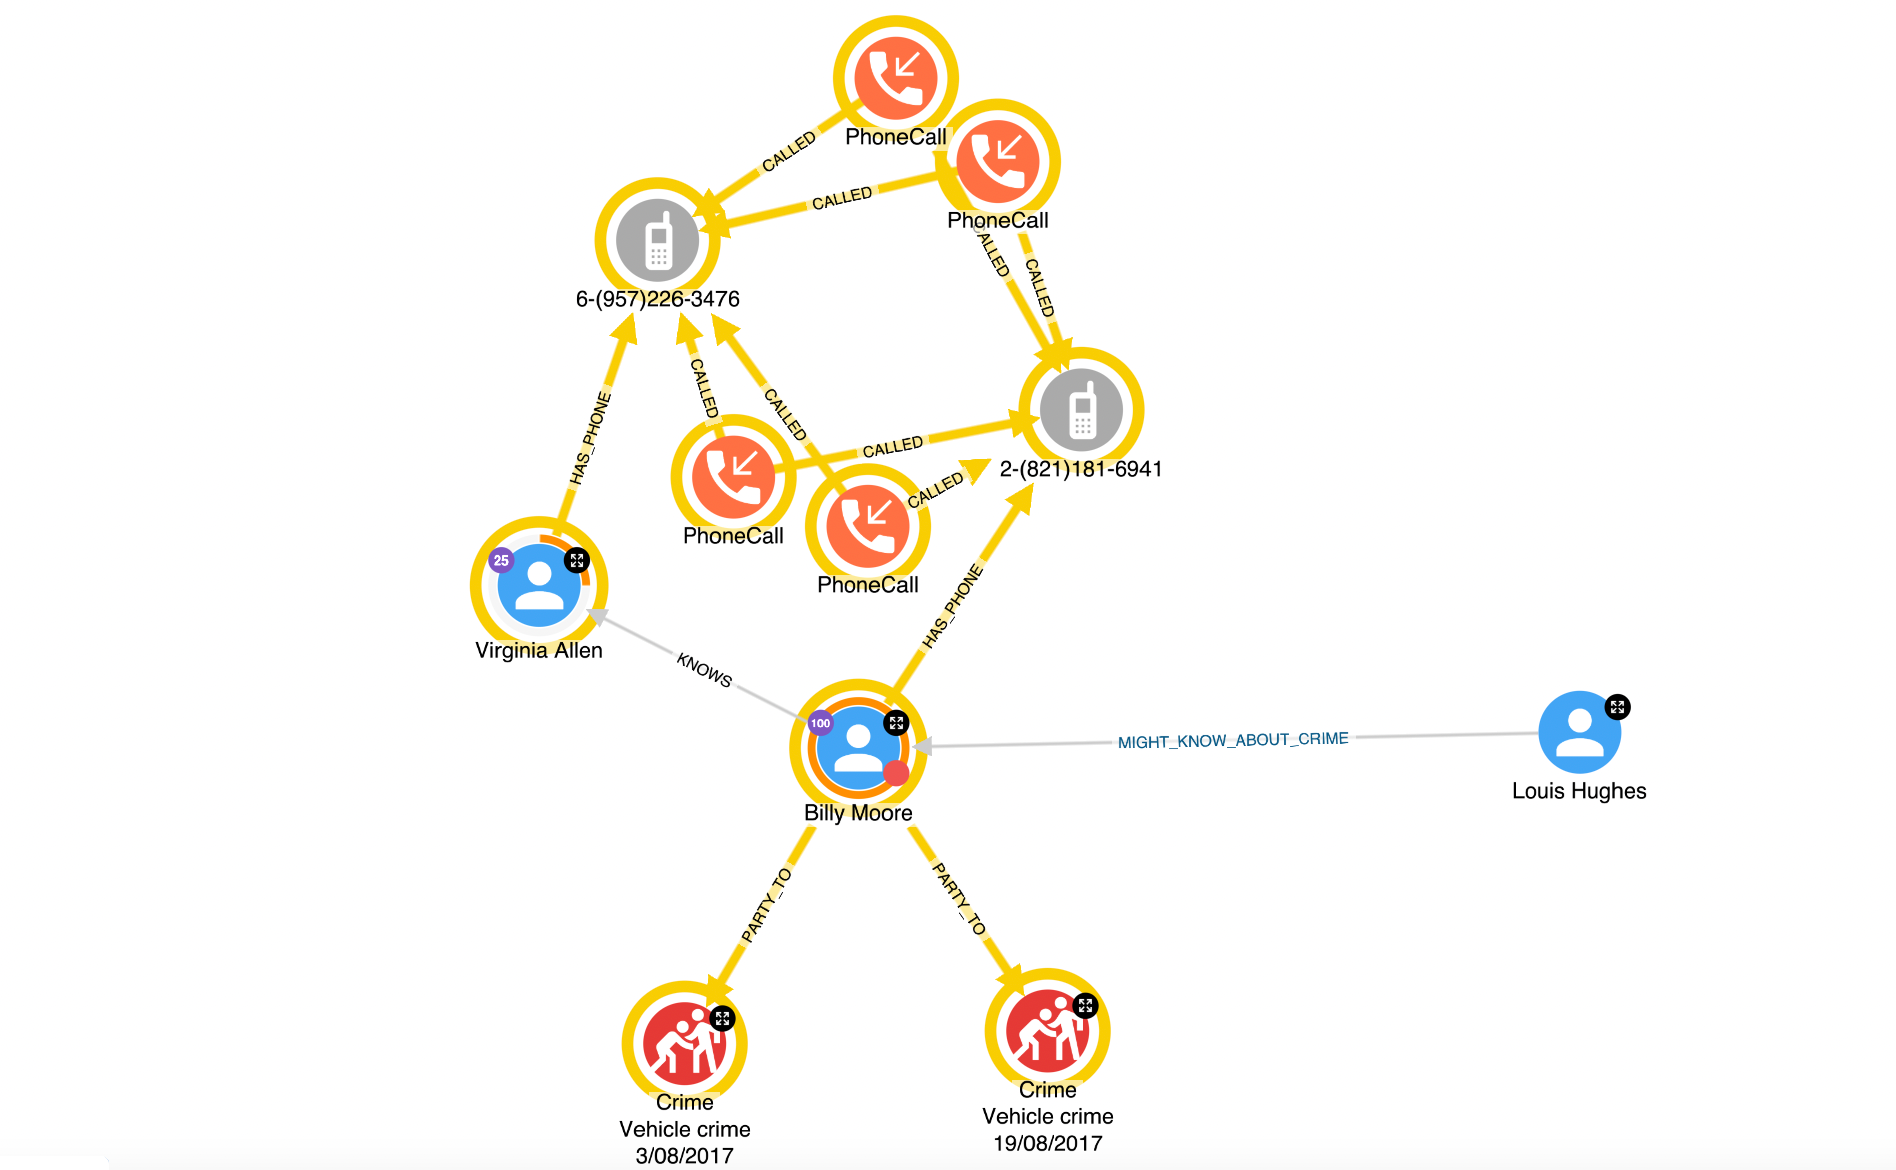
Let me give you an example. In a properly implemented fraud detection system, an autonomous analytics engine should block potential fraud by rejecting a credit card transaction. When the owner of the card calls to understand the reasons behind such a decision, the operator should immediately understand how the machine came to the conclusion and immediately verify all the relevant information and, eventually, unblock the card and authorise the payment. The same would be for a system fighting scamming, for a police patrol system and so on. In many of these scenarios, a KG is a key element of the picture.
Why compete on analytics with knowledge graphs?
At this point, it should be easy to answer such a question. The success stories and the analytics (re)volution enlightened the motivations, the needs and the criticalities that drove and adjusted the journey of many different companies and organisations until today:
- The companies, in particular at the early stages, use simple data models
- The Data lake has no metadata, we just store data with no clear understanding of what we are saving and how to reach out to that.
- Machine learning algorithms very often offer black box models
- Analysts, primarily for mission-critical applications, would like to deeply understand the models and be involved in the final decision-making process
- We need a data representation model that covers the heterogeneity of different data sources offering a cohesive modelling structure.
Representing the full available knowledge as graphs helps the analytics to improve the accuracy and simplify the explainability. At the same time, it makes it easier for humans to navigate, explore and understand the information captured and even contextualise it. The biggest advantage of a knowledge graph-based paradigm compared with the other mentioned so far are:
- A single, schema-free, data model to capture the diversity of the different data sources with heterogeneous structure.
- A single knowledge representation understandable by humans and machines.
- The opportunity to store the metadata, i.e. description of the data, with the data itself.
- An easy-to-navigate and explore solution that increases transparency and explainability.
These considerations become a must when we talk about mission-critical applications where the life of a person or entire communities is at risk. Think for example of healthcare, homeland security or law enforcement scenarios. In those cases, organisations need to collect data from multiple sources and represent the collective knowledge in a single connected source of truth, where both machines and humans collaborate to provide complex predictive analytics output. In these scenarios, analysts must be able to fully understand the results of autonomous analytics and demonstrate them, because they affect people’s lives. In these contexts graphs represent the centre of multifaceted applications where analysts:
- Collect, annotate and share information
- Explore and navigate knowledge to any desired level of detail
- Get an explanation of machine learning-produced results or suggestions
- Collaborate with internal and external entities
- Are altered whenever a condition is met (a person of interest calling another one, a patient experience some symptoms)
Conclusion
The intent of this blog post is to stimulate readers interest in analytics as a tool to compete against fraudsters, terrorists, thieves or with other similar companies. The success stories presented showed that this is possible by leveraging the data already available because nowadays, any company or organisation collects enough information. Explainable AI and Knowledge graphs represent the natural evolution of a journey that started 15 years ago. They removed some of the obstacles that limited the applicability of analytics in certain mission-critical applications. It is an amazing journey that has just begun and the pot of gold at the end of the rainbow is not merely a better movie to watch but could be a safer country, a more secure transaction system, or more effective medical advances.
References
[3] J. Angwin, J. Larson, S. Mattu, and L. Kirchner. 2016. _Machine bias. _
https://www.propublica.org/article/machine-bias-risk-assessments-in-criminal-sentencing
[4] Gilpin, Leilani & Bau, David & Yuan, Ben & Bajwa, Ayesha & Specter, Michael & Kagal, Lalana. 2018. Explaining Explanations: An Overview of Interpretability of Machine Learning. 80-89. 10.1109/DSAA.2018.00018.
[5] G. Marcus. 2018. Deep learning: a critical appraisal. arXiv preprint, arXiv:1801.00631.
[6] F. van Harmelen, A. ten Teije. 2019. A boxology of design patterns for hybrid learning and reasoning systems, J. Web Eng. 18(1) 97–124.
[7] Ilaria Tiddi and Stefan Schlobach. 2022. Knowledge graphs as tools for explainable machine learning: A survey. Artif. Intell. 302, C (Jan 2022). https://doi.org/10.1016/j.artint.2021.103627