As the Chief Scientist at GraphAware, I have the privilege of working at the forefront of two exciting and rapidly evolving fields: graph technology and machine learning. These technologies have seen remarkable progress in recent years, and I am excited to share with you some of the latest developments and breakthroughs that are transforming the way we think about data and its potential.
The modernisation of data platforms and the ever-growing availability of data mean that analysts need tools that highlight the information they need to know and when they need to know it. Alerting has become a core feature in many case management and intelligence applications, helping intelligence analysts and investigators keep on top of the changing information landscape for their entities of interest.
In this 3-part series “Know what you know: Competing on Analytics with Knowledge Graphs” Dr. Alessandro Negro, Chief Scientist at GraphAware, walks you through analytics, knowledge graphs and its “competition”. In the first part we discussed the recipe for a successful analytics competition and shared some success stories. In the second part we saw the 4 first stages of the analytics revolution.
In this 3-part series “Know what you know: Competing on Analytics with Knowledge Graphs” Dr. Alessandro Negro, Chief Scientist at GraphAware, walks you through analytics, knowledge graphs and its “competition”. In the first part, we discussed the recipe for a successful analytics competition and shared some success stories.
In this 3-part series “Know what you know: Competing on Analytics with Knowledge Graphs” Dr. Alessandro Negro, Chief Scientist at GraphAware, walks you through analytics, knowledge graphs and its “competition”.
In the series Graphs in Law Enforcement, we discussed data sources and modelling, data quality and credibility with source ratings, and we spoke about fusing entities.
In the first part of the series Graphs in Law Enforcement, Data sources and modelling, we discussed graphs in law enforcement investigations, their data sources, data provenance, INTs and how to model sources in graphs. In part 2, Data quality and credibility, we covered source ratings (source reliability & information credibility) and their importance in investigation graphs for law enforcement.
In this 4-part blog series “Graphs in Law Enforcement”, we will examine Data Sources in Law Enforcement Graphs, a talk by Luanne Misquitta, our VP of Engineering, at GraphConnect 2022.
Criminal investigations are driven by finding the connections and hidden links between wide-ranging sources of data to ultimately disrupt criminal activity. Graph solutions are a powerful tool for law enforcement to optimise their interaction with data from these varied sources.
So far, we have learned about collaborative filtering, content-based, and session-based recommendations. None of these approaches takes the situational context under consideration. Factors such as mood, occasion, location, company, etc., can affect user preferences and needs. Context-aware recommendations take these conditions into account to provide more relevant recommendations.
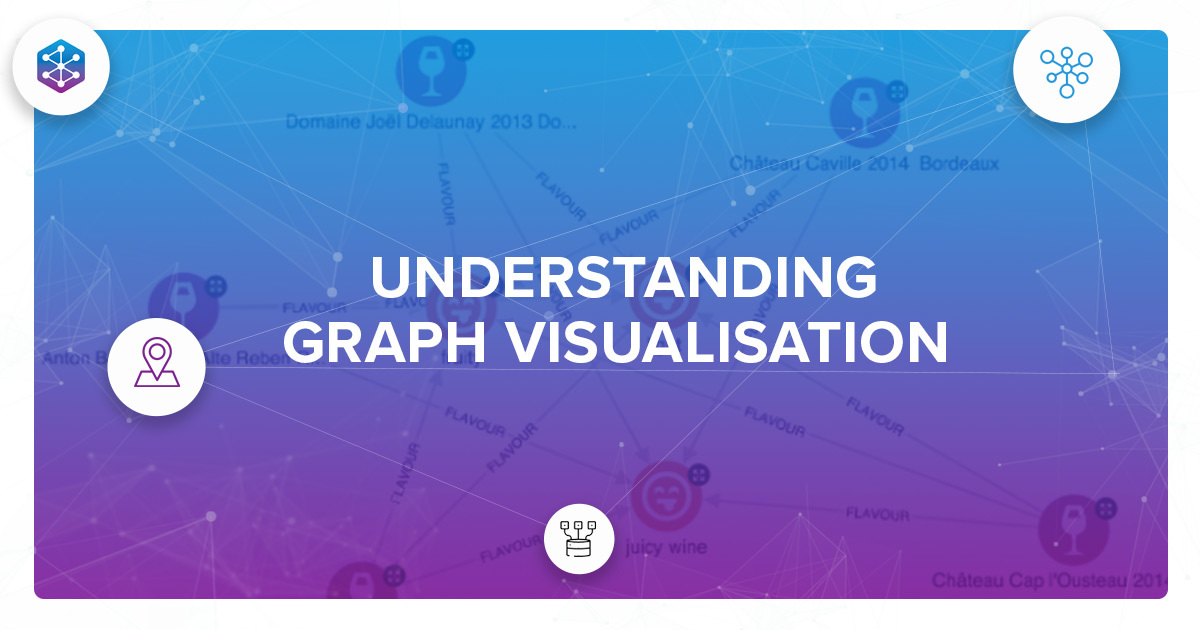
Graph visualisation is just what it sounds like - a visual representation of your data as a graph. A graph is a structure of objects that are connected. Thus graph visualisation is the visualisation of entities (nodes), and relationships among them.
Graph-Powered Machine Learning has already introduced us to content-based recommendations and collaborative filtering. These are the two most used approaches to providing recommendations. However, they both need information about the users to do so. What if you do not have user information? That’s where session-based recommendations come in.
Welcome back to the Graph-Powered Machine Learning book club. Now we are in the section of the book that focuses on recommendations. In the last blog, I summed up how content-based recommendations work. In the fifth chapter, the author Alessandro Negro introduces us to collaborative filtering.
So far, the Graph-Powered Machine Learning book has introduced us to graphs and machine learning. The second part of the book talks about recommendations. Recommender systems (RS) gather information about users and items and provide item suggestions, bringing great value to online stores - clothing stores, bookstores, you name it. Companies like Netflix base their entire businesses on high performing recommender systems.
What have we learned from Graph-Powered Machine Learning so far?
Welcome back to the Graph-Powered Machine Learning book club. As you know by now, Graph-Powered Machine Learning is a book written by our very own Dr. Alessandro Negro. The book is a must-read for all data scientists, but it’s also a great read for everyone interested in graphs. In this blog series, I summarise the key points of each chapter and provide some more explanations useful for us less technically savvy. We learned the basics about machine learning, graphs, and why the two are a great fit in the first chapter.
There are a multitude of databases to choose from when deciding how to store your data. They differ in complexity, scalability, data modelling possibilities they offer, and application. Let’s walk through some of the most popular databases and their differences.
As you know, our Chief Scientist, Dr. Alessandro Negro, recently published a book titled Graph-Powered Machine Learning. We are very proud of the Chief, and very excited about the book. We're even planning an event, where you'll be able to ask Alessandro anything about it!But what is really in the book? Let me share what the first chapter is about so you know what you're in for - a treat! The book opens with an introduction to Machine Learning and Graphs. The first chapter covers Machine Learning, some of the challenges of Machine Learning, Graphs, and the role Graphs play...
Welcome to the first blog in the business series of GraphAware blog! This series is designed for us non-techies out there. Personally, I was shocked when I found out how big and common knowledge graphs are and how often graph databases are used in today's world - and I had first heard of them just a couple of months ago. So, for people like me, for marketers and non-tech people in business, I'll try to open the door to the world of graphs, and their potential and take you through it step-by-step. It seems only appropriate that we start with...